
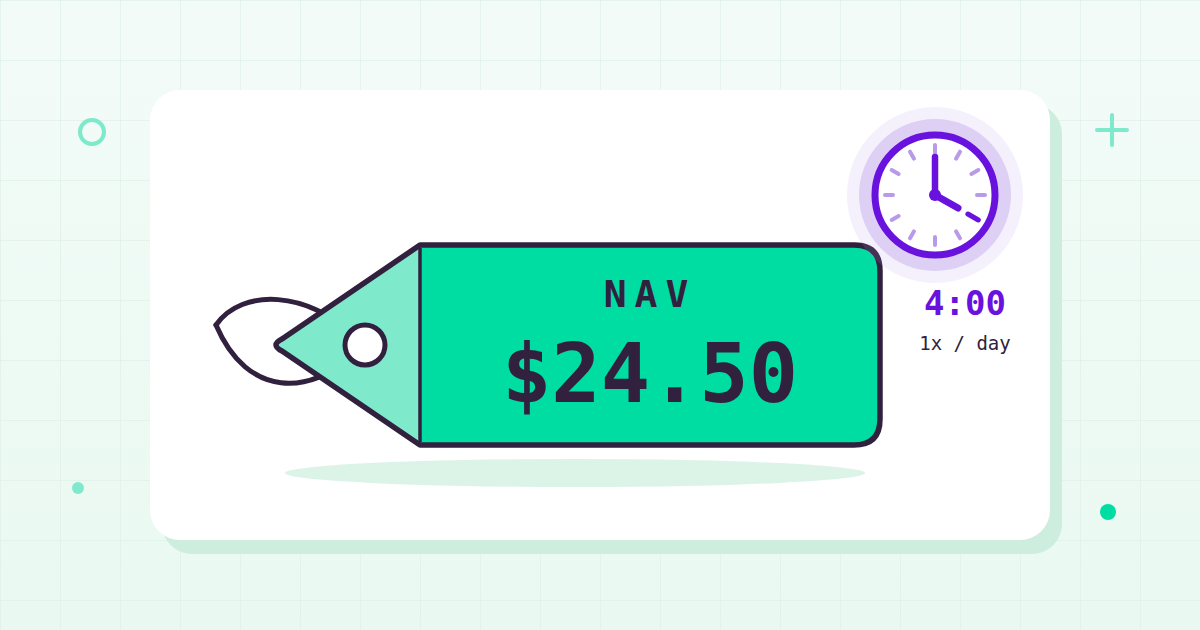
Mutual fund prices work differently from almost every other price in markets, and the difference trips up plenty of smart people. A stock’s price changes every second the market is open. A mutual fund’s price is calculated exactly once per trading day, after the market closes. Understand that one fact, and most of the confusion around mutual fund prices disappears.
Let me explain.
A mutual fund is a pooled portfolio of investments – stocks, bonds, or other securities – and when you buy in, you own shares of the fund itself, not the individual securities inside it. Some funds are run by managers actively picking investments; others simply track an index. Either way, the fund’s price follows the same rules, and those rules are worth understanding before you look at a single quote.
Here’s how mutual fund prices are calculated, where to find them, and what the numbers can (and can’t) tell you.
How Are Mutual Fund Prices Calculated?
A mutual fund is priced at its net asset value (NAV):
NAV = (total assets minus liabilities) / shares outstanding
Take everything the fund owns (all its holdings, priced at their closing values, plus any cash), subtract what the fund owes (accrued fees and other liabilities), and divide by the number of fund shares outstanding. A hypothetical fund with $500 million in assets, $10 million in liabilities, and 20 million shares outstanding would have a NAV of $24.50 per share.
The formula is the easy part. The part people miss is when it happens.
NAV is calculated once per trading day, after the market closes (4:00 p.m. ET for US funds). Mutual funds do not trade continuously at fluctuating intraday prices the way stocks and ETFs do. There is no bid, no ask, no ticker crawling across a screen during the day. One number, once a day.
This leads to something called forward pricing. When you place an order to buy or sell a mutual fund, it doesn’t execute at the last published NAV – it executes at the next NAV computed after your order is received. Place an order at 11 a.m. and you’ll transact at that evening’s NAV, whatever it turns out to be. Miss the fund’s cutoff (typically the market close) and you’ll get the following day’s NAV instead.
Buying something without knowing the exact price sounds uncomfortable the first time you hear it. In practice it’s a fairness mechanism: everyone who orders during the same window gets the same price, and nobody gets to trade on stale numbers.
A Low NAV Does Not Make a Fund Cheap
This one deserves its own heading because it’s the most common misreading of mutual fund prices.
A fund with a $15 NAV is not a better bargain than a fund with a $450 NAV. NAV is simply the portfolio’s value divided by the share count, and the share count is an accounting artifact – it says nothing about the quality or value of what’s inside. A stock can trade below what the business is worth. A fund’s NAV, by definition, is exactly what the underlying holdings are worth per share. It can’t be “undervalued” the way a stock can.
One related quirk: when a fund pays out dividends or capital gains distributions, its NAV drops by roughly the amount of the distribution. The money didn’t vanish – it moved from the fund’s assets to your account. A falling NAV on a distribution date is bookkeeping, not bad news.
So what actually matters when comparing funds? What the fund holds, what strategy it follows, and what it charges. The per-share sticker price is close to meaningless.
Where Can I Find Mutual Fund Prices?
Daily NAVs are easy to find. The fund company’s own website publishes them, your broker displays them, and research sites like Morningstar (whose fund-level research is genuinely excellent) list them alongside analysis. Financial news sites carry them too.
If you want the data programmatically – to chart a fund’s full history, compare many funds at once, or feed an analysis tool – that’s where we can help. Tiingo’s end-of-day price data API covers mutual funds as part of 80,000+ assets (US equities, ETFs, mutual funds, and Chinese A-shares), with 30+ years of price history. And because mutual funds price once a day by design, end-of-day NAV history is the complete picture of a fund’s price record. Nothing happens between the closes, so nothing is missing.
Why Time and Compounding Matter (and Why Nobody Can Promise You a Return)
Search for a mutual fund calculator and you’ll find plenty of tools happy to project what an investment becomes over 10 years at whatever growth rate you type in. The output is exactly as reliable as the number you typed – which is to say, it’s a guess. Markets don’t take assumptions as instructions.
What is real is the mechanism of compounding. When a fund’s distributions are reinvested, they buy more shares, and those shares generate their own returns going forward. Gains earn on gains. Given enough time, that mechanism is powerful – it’s why time horizon gets so much attention in investing, and deservedly so. But a mechanism is not a promise. Compounding operates on whatever sequence of returns actually happens, and no one knows that sequence in advance. Anyone who hands you a single confident number for the next decade is guessing, however polished the calculator looks.
Compounding also runs in reverse on costs. Every fund charges an expense ratio – an annual fee taken out of the fund’s assets, already reflected in the NAV you see. It looks like a small percentage, but it comes out every year, forever, and it compounds against you the same way returns compound for you. Two funds holding similar portfolios can end up in very different places over a couple of decades purely because of the fee gap. This is why the fee table in a fund’s prospectus deserves a careful read.
How Useful Is Historical Mutual Fund Price Data?
Past performance does not guarantee future results. That’s not a disclaimer to skim past – it’s simply true, and it’s the right frame for everything in this section.
Used properly, though, a fund’s price history is one of the most informative things you can study. Context in markets is everything, and history is where the context lives. A long NAV series can show you:
- How volatile the fund actually is – not how volatile its category name suggests it should be.
- How it behaved in stressed markets – drawdowns tell you more about a fund’s character than its best year does.
- How it tracks against its benchmark and peers – a fund’s returns only mean something relative to what it was trying to do.
- Whether the record matches the stated strategy – a “conservative income” fund with wild swings in its history is telling you something the marketing isn’t.
This is also why depth of history matters. A fund’s behavior through multiple market regimes – booms, busts, and the boring stretches in between – is far more informative than one hot year. It’s the same reason quantitative investors are careful about how they analyze markets: a single favorable period can make almost anything look brilliant.
How to Invest in Mutual Funds
Most mutual funds aren’t bought on a stock exchange. You buy them through a broker (Fidelity, Charles Schwab, Vanguard, and many others) or directly from the fund company, and your order executes at the next computed NAV, as covered above.
For anyone new to this, the process generally looks like:
- Read the prospectus. It’s the fund’s official document: objectives, strategy, risks, and the fee table, all in one place. It’s dry reading, and it’s the single most useful document a fund publishes.
- Check the expense ratio. As above – fees compound over time, so this number matters more than its size suggests.
- Study the history in context. Compare the fund against its benchmark and its category peers, and look at how it behaved across different market environments, not just recently.
- Check the practical details. Many funds have investment minimums, some come in multiple share classes with different fees, and some brokers charge transaction fees on certain funds. Worth knowing before you click.
- Place the order. It will execute at the next NAV, calculated after the market closes – so you’ll see your exact price that evening, not the moment you submit.
And remember what you’re buying: shares of the fund, priced once a day at NAV, not the underlying securities themselves.
Track Mutual Fund Prices With Clean, Licensed Data
Since 2014, Tiingo’s mission has been making high-end financial data accessible and affordable to everyone – our motto is “Actively Do Good,” and we mean it. We’ve never taken a dollar of venture funding and we’ve been profitable for 8+ years, which is exactly why we can price the way we do: sustainably, at levels a retail investor can actually use.
Our data is flat-rate, licensed, and error-checked, and mutual funds are covered right alongside stocks and ETFs in our 80,000+ asset universe. The free Starter plan is $0 and includes 500 unique symbols per month, 50 requests per hour, 1,000 requests per day, and 30+ years of price history – enough to seriously study a fund’s full record without paying anything. When you need more, Power is $30/month and Commercial is $50/month. That’s the whole pricing page, more or less. We don’t believe in holding good data hostage.
If you want to explore a fund’s price history yourself, start with our end-of-day price data, or create a free account and pull your first NAV series today. We’d love to have you.